Fil:1000 Year Temperature Comparison.png

Sidans innehåll stöds inte på andra språk.
Från Wikipedia

1000_Year_Temperature_Comparison.png(599 × 442 pixlar, filstorlek: 32 kbyte, MIME-typ: image/png)

Denna bild (eller alla bilder i denna artikel eller kategori) bör återskapas med hjälp av vektorgrafik som en SVG-fil. Detta har flera fördelar; se Commons:Media for cleanup för mer information. Om det redan existerar en SVG-version av denna bild, var vänlig och lägg upp den. Efter att en SVG-version lagts upp, ersätt denna mall med {{vector version available|nytt bildnamn.svg}} på denna sida.

Sammanfattning

Beskrivning
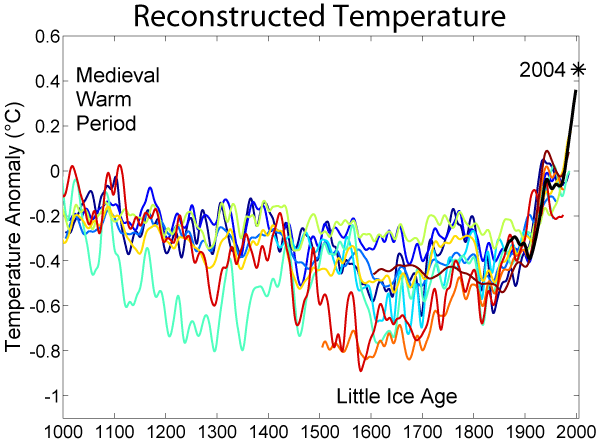
English: This image is a comparison of 10 different published reconstructions of mean temperature changes during the 2nd millennium. More recent reconstructions are plotted towards the front and in redder colors, older reconstructions appear towards the back and in bluer colors. An instrumental history of temperature is also shown in black. The medieval warm period and little ice age are labeled at roughly the times when they are historically believed to occur, though it is still disputed whether these were truly global or only regional events. The single, unsmoothed annual value for 2004 is also shown for comparison. (Image:Instrumental Temperature Record.png shows how 2004 relates to other recent years).

It is unknown which, if any, of these reconstructions is an accurate representation of climate history; however, these curves are a fair representation of the range of results appearing in the published scientific literature. Hence, it is likely that such reconstructions, accurate or not, will play a significant role in the ongoing discussions of global climate change and global warming.

For each reconstruction, the raw data has been decadally smoothed with a σ = 5 yr Gaussian weighted moving average. Also, each reconstruction was adjusted so that its mean matched the mean of the instrumental record during the period of overlap. The variance (i.e. the scale of fluctuations) was not adjusted (except in one case noted below).

Except as noted below, all original data for this comparison comes from here and links therein. It should also be noted that many reconstructions of past climate report substantial error bars, which are not represented on this figure.
Datum
Källa http://www.globalwarmingart.com/wiki/File:1000_Year_Temperature_Comparison.png
Skapare Robert A. Rohde
Andra versioner

Reconstructions

The reconstructions used, in order from oldest to most recent publication are:

  1. (dark blue 1000-1991): The Holocene.
  2. (blue 1000-1980): Geophysical Research Letters.
  3. (light blue 1000-1965): Ambio. Modified as published in Science.
  4. (lightest blue 1402-1960): J. Geophys. Res..
  5. (light green 831-1992): Science.
  6. (yellow 200-1980): Geophysical Research Letters. doi:10.1029/2003GL017814.
  7. (orange 200-1995): Reviews of Geophysics. doi:10.1029/2003RG000143
  8. (red-orange 1500-1980): Geophys. Res Lett.. doi:10.1029/2004GL019781
  9. (red 1-1979): Nature. doi:10.1038/nature03265
  10. (dark red 1600-1990): Science. doi:10.1126/science.1107046

(black 1856-2004): Instrumental data was jointly compiled by the Climatic Research Unit and the UK Meteorological Office Hadley Centre. Global Annual Average data set TaveGL2v [1] was used.

Documentation for the most recent update of the CRU/Hadley instrumental data set appears in: Journal of Climate.

Licensiering

The original version of this figure was prepared by Robert A. Rohde from publicly available data and is incorporated into the Global Warming Art project.

Image from Global Warming Art
This image is an original work created for Global Warming Art. Please refer to the Year Temperature Comparison.png image description page for more information.
GNU head Tillstånd ges att kopiera, distribuera och/eller modifiera detta dokument under villkoren i GNU Free Documentation License, Version 1.2 eller senare version publicerad av Free Software Foundation, utan oföränderliga avsnitt, framsidestexter eller baksidestexter. En kopia av licensen ingår i avsnittet GNU Free Documentation License.
w:sv:Creative Commons
erkännande dela lika
Denna fil har gjorts tillgänglig under licensen Creative Commons Erkännande-Dela Lika 3.0 Generisk
Du är fri:
  • att dela – att kopiera, distribuera och sända verket
  • att remixa – att skapa bearbetningar
På följande villkor:
  • erkännande – Du måste ge lämpligt erkännande, ange en länk till licensen och indikera om ändringar har gjorts. Du får göra det på ett lämpligt sätt, men inte på ett sätt som antyder att licensgivaren stödjer dig eller din användning.
  • dela lika – Om du remixar, transformerar eller bygger vidare på materialet måste du distribuera dina bidrag under samma eller en kompatibel licens som originalet.
Detta licenstillägg lades till till denna fil som en del av GFDL:s licensuppdatering.


Notes

  1. Data from Moberg et al. was taken directly from the supplemental information accompanying the Nature article.
  2. Data for Oerlemans was provided by William M. Connolley.
  3. Esper et al. reported only fluctuations in "arbitrary" units, so the variance in this record was rescaled to match the variance during the period of overlap with the instrumental record.
  4. When a paper included multiple reconstructions, the global annually average temperature data was used. If this was not reported, then Northern Hemisphere annually averaged data was used.
  5. Four records appearing at [2] were not used in preparing this graph for the following reasons:
    1. Mann et al. 98 was not included because Mann et al. 99 extended and updated that record.
    2. Briffa et al. 98 was not included because Briffa et al. 2001 extended and updated that record.
    3. Pollack et al. 98 was not included because the reported data was not found to be in a form that allowed for easy replotting.
    4. Mann et al. 2000 was not used because it did not include an original reconstruction covering at least the Northern Hemisphere.


Dragons flight's Temperature Record Series
This figure is part of a series of plots created by Dragons flight to illustrate
changes in Earth's temperature and climate across many different time scales.
Time Period: 25 yrs | 150 yrs | 1 kyr | 2 kyr | 12 kyr | 450 kyr | 5 Myr | 65 Myr | 500 Myr
For articles related to this topic see: Temperature record

Bildtexter

Ingen bildtext har definierats

Objekt som porträtteras i den här filen

motiv

image/png

896104465de636e551cb77de82d0892e1e892551

32 749 byte

442 pixel

599 pixel

Filhistorik

Klicka på ett datum/klockslag för att se filen som den såg ut då.

Datum/TidMiniatyrbildDimensionerAnvändareKommentar
nuvarande22 november 2019 kl. 01.14Miniatyrbild för versionen från den 22 november 2019 kl. 01.14599 × 442 (32 kbyte)MyridiumSomebody updated the image with a "2016" label that isn't even included in the data analysed! Data analysed only goes up to 2004.
5 maj 2019 kl. 08.54Miniatyrbild för versionen från den 5 maj 2019 kl. 08.54599 × 500 (48 kbyte)TobusUpdate to show 2016 temperature anomaly
16 juli 2014 kl. 19.10Miniatyrbild för versionen från den 16 juli 2014 kl. 19.10599 × 442 (32 kbyte)JeffyPShrinkin' the image.
18 december 2005 kl. 00.51Miniatyrbild för versionen från den 18 december 2005 kl. 00.51599 × 442 (40 kbyte)Saperaud~commonswiki*'''Description:''' [[en:Image:{{subst:PAGENAME}}]]

Inga sidor använder den här filen.

Global filanvändning

Följande andra wikier använder denna fil: