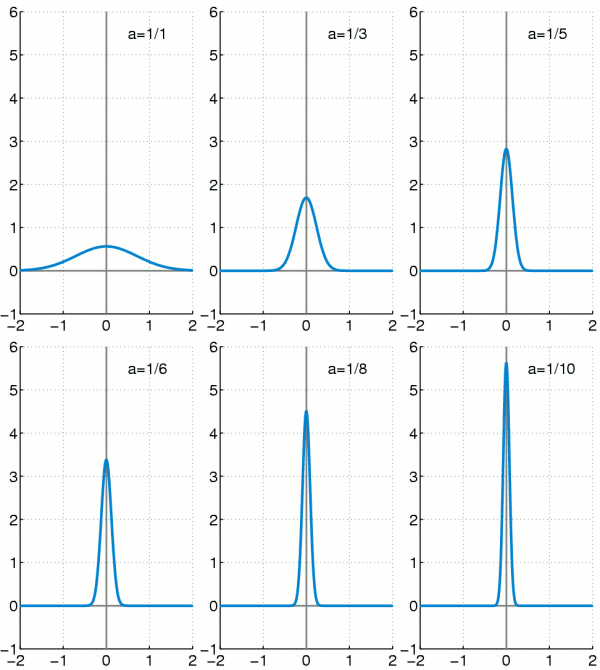
Fil:Dirac function approximation.gif
Dirac_function_approximation.gif (200 × 335 pixlar, filstorlek: 89 kbyte, MIME-typ: image/gif, upprepad, 10 bildrutor, 2,0 s)
Filhistorik
Klicka på ett datum/klockslag för att se filen som den såg ut då.
| Datum/Tid | Miniatyrbild | Dimensioner | Användare | Kommentar | |
|---|---|---|---|---|---|
| nuvarande | 13 januari 2008 kl. 00.51 |  | 200 × 335 (89 kbyte) | Oleg Alexandrov | tweak |
| 13 januari 2008 kl. 00.22 |  | 217 × 363 (99 kbyte) | Oleg Alexandrov | {{Information |Description=Illustration of approximating the Dirac delta function by gaussians. |Source=self-made with MATLAB |Date=~~~~~ |Author= Oleg Alexandrov |Permission= |other_versions= }} {{ |
Filanvändning
Följande 2 sidor använder den här filen:
Global filanvändning
Följande andra wikier använder denna fil:
- Användande på ar.wikipedia.org
- Användande på bg.wikipedia.org
- Användande på bn.wikipedia.org
- Användande på cs.wikipedia.org
- Användande på da.wikipedia.org
- Användande på de.wikipedia.org
- Användande på el.wikipedia.org
- Användande på en.wikipedia.org
- Användande på en.wikibooks.org
- Användande på fa.wikipedia.org
- Användande på fi.wikipedia.org
- Användande på fr.wikipedia.org
- Användande på he.wikipedia.org
- Användande på hi.wikipedia.org
- Användande på hu.wikipedia.org
- Användande på id.wikipedia.org
- Användande på it.wikipedia.org
- Användande på ka.wikipedia.org
- Användande på ko.wikipedia.org
- Användande på nl.wikipedia.org
- Användande på no.wikipedia.org
- Användande på pt.wikipedia.org
- Användande på ro.wikipedia.org
- Användande på simple.wikipedia.org
- Användande på si.wikipedia.org
- Användande på sl.wikipedia.org
- Användande på sr.wikipedia.org
- Användande på uk.wikipedia.org
- Användande på vi.wikipedia.org
- Användande på zh.wikipedia.org

