
Fil:South Africa 2001 Northern Sotho speakers proportion map.svg

Storleken för denna PNG-förhandsvisning av denna SVG-fil: 689 × 600 pixlar. Andra upplösningar: 276 × 240 pixlar | 552 × 480 pixlar | 882 × 768 pixlar | 1 177 × 1 024 pixlar | 2 353 × 2 048 pixlar | 1 072 × 933 pixlar.
Originalfil (SVG-fil, standardstorlek: 1 072 × 933 pixlar, filstorlek: 228 kbyte)
| Denna fil tillhandahålls av Wikimedia Commons. Informationen nedan är kopierad från dess filbeskrivningssida. |
Sammanfattning
| Beskrivning |
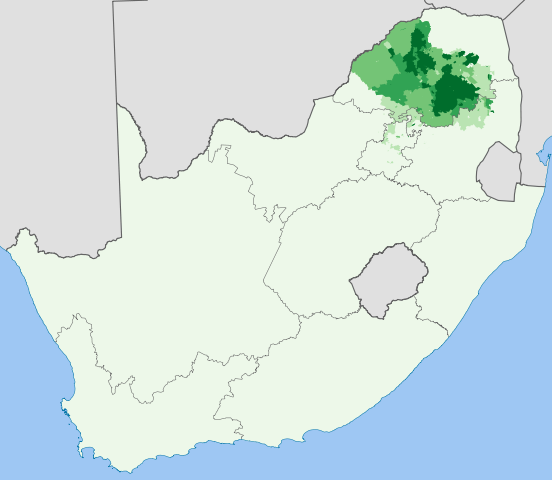
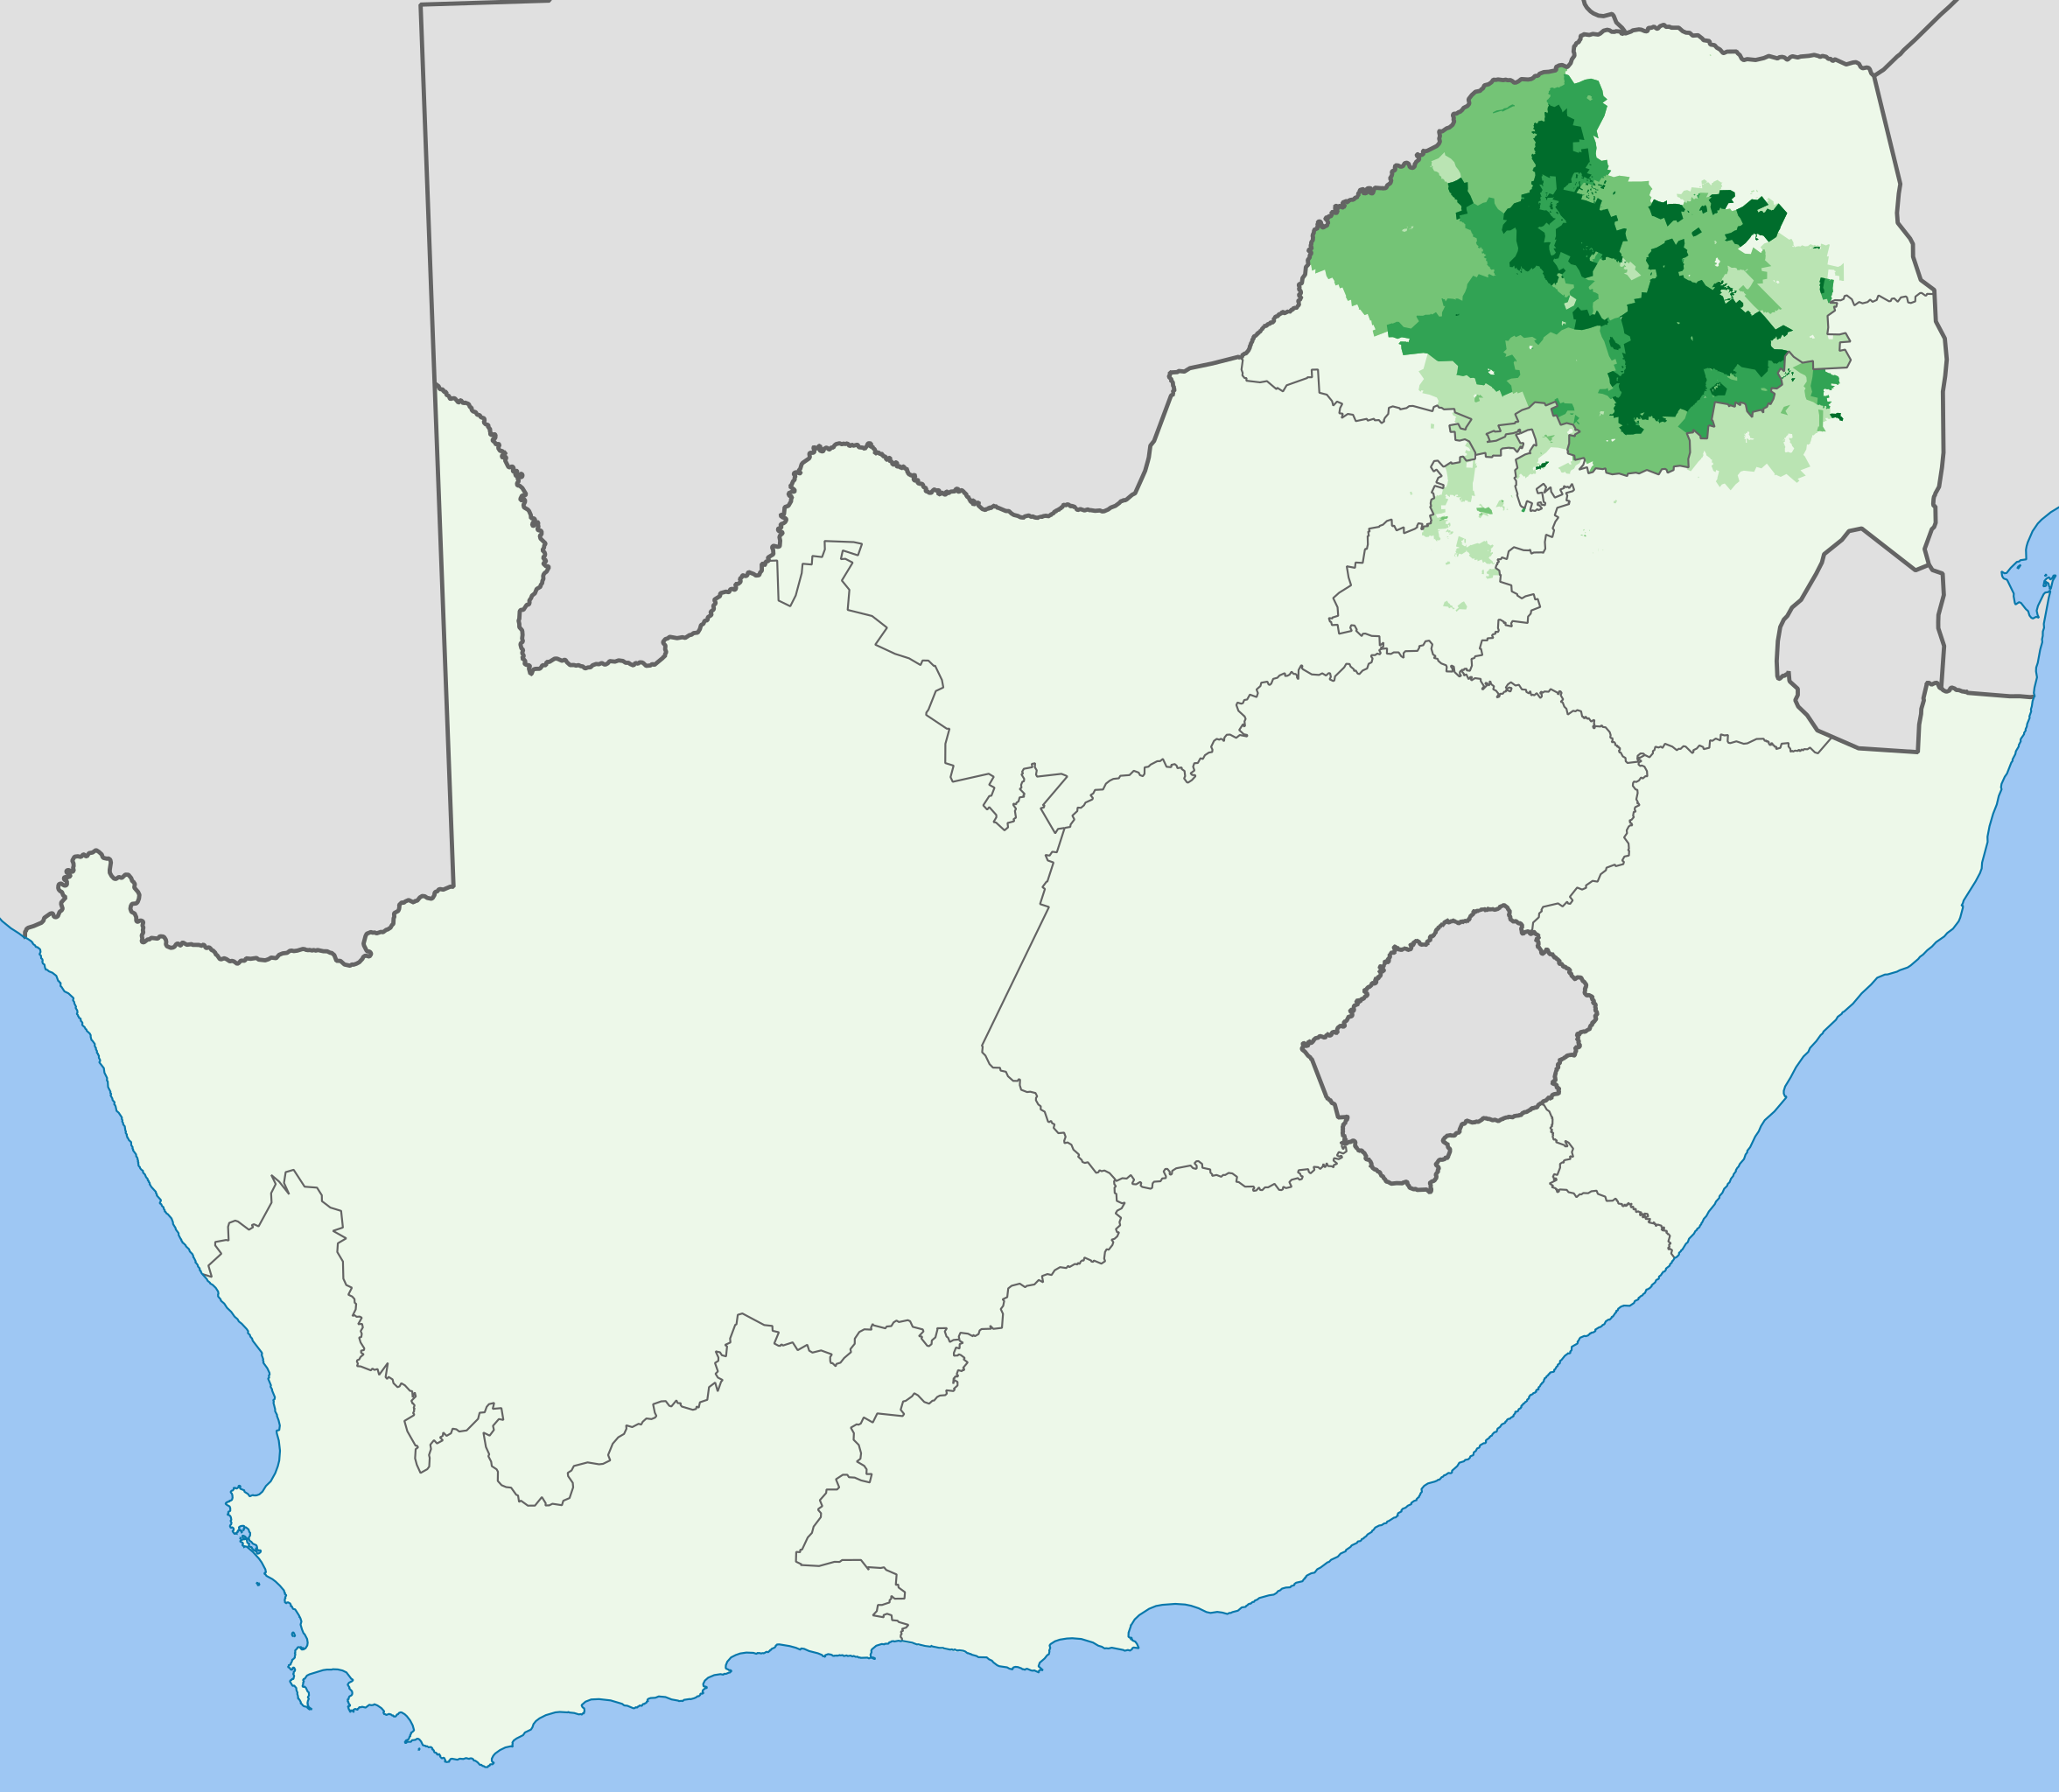
English: Map showing the proportion of the South African population that speaks Sesotho sa Leboa at home, from the 2001 census broken down to "Main Place" level.
0–20%
20–40%
40–60%
60–80%
80–100%
Projection is Albers Equal-Area Conic, with standard parallels at 25.5° S and 31.5° S, and origin at 28.5° S 25.5° E. |
| Datum | |
| Källa | Statistics South Africa's Census 2001 is the source of the basic population data. The map results from my own processing of the data. |
| Skapare | Htonl |
Licensiering
The following license applies to the population data on which the map is based:

|
Upphovsrättsinnehavaren till denna fil, Stats SA, tillåter vem som helst att använda den i valfritt syfte, förutsatt att lämplig hänvisning till upphovsrättsinnehavaren ges.
Vidaredistribution, redigering av verk, kommersiell användning och all övrig användning är tillåten. |
Erkännande:
"the user acknowledges Stats SA as the source of the basic data wherever they process, apply, utilise, publish or distribute the data, and also that they specify that the relevant application and analysis (where applicable) result from their own processing of the data" [1]
|
The following tag applies to the map itself:
| Jag, upphovsrättsinnehavaren till detta verk, släpper detta verk i public domain. Detta gäller globalt. I vissa länder kan detta inte vara juridiskt möjligt; i så fall: Jag ger härmed envar rätten att använda detta verk för alla ändamål, utan några villkor, förutom villkor som lagen ställer. |
Filhistorik
Klicka på ett datum/klockslag för att se filen som den såg ut då.
| Datum/Tid | Miniatyrbild | Dimensioner | Användare | Kommentar | |
|---|---|---|---|---|---|
| nuvarande | 3 april 2012 kl. 21.08 | | 1 072 × 933 (228 kbyte) | Htonl | styles, color handling, color scheme |
| 29 november 2010 kl. 12.46 |  | 1 072 × 933 (634 kbyte) | Htonl | remove grey "undefined" areas by drawing from municipal data | |
| 2 oktober 2010 kl. 16.05 |  | 1 072 × 933 (639 kbyte) | Htonl | new approach, smaller filesize | |
| 1 oktober 2010 kl. 22.48 |  | 1 072 × 933 (2,92 Mbyte) | Htonl | use equal-area projection | |
| 16 februari 2010 kl. 21.25 |  | 1 000 × 786 (2,81 Mbyte) | Htonl | tweak | |
| 6 februari 2010 kl. 23.47 |  | 1 000 × 786 (3,04 Mbyte) | Htonl | == Summary == {{Information |Description={{en|1=Map showing the proportion of the South African population that speaks Sesotho sa Leboa at home, from the 2001 census broken down to "Main Place" level. {{legend|#eff3ff|0–20%}} {{legend|#bdd7e7|20–40%}} |
Filanvändning
Inga sidor använder den här filen.
Global filanvändning
Följande andra wikier använder denna fil:
- Användande på az.wikipedia.org
- Användande på eu.wikipedia.org
- Användande på fi.wikipedia.org
- Användande på xh.wikipedia.org