
Fil:Milankovitch Variations.png
Milankovitch_Variations.png (479 × 363 pixlar, filstorlek: 32 kbyte, MIME-typ: image/png)
| Denna fil tillhandahålls av Wikimedia Commons. Informationen nedan är kopierad från dess filbeskrivningssida. |
Sammanfattning
| Beskrivning |
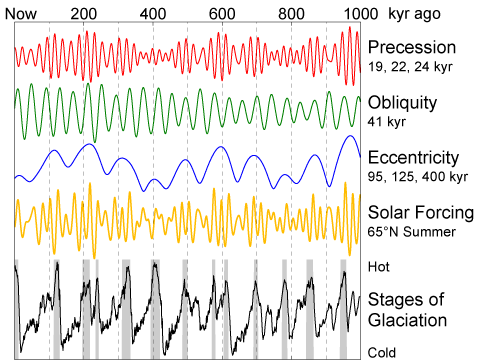
English: This figure shows the variations in Earth's orbit, the resulting changes in solar energy flux at high latitude, and the observed glacial cycles.
According to Milankovitch Theory, the precession of the equinoxes and the apsides, variations in the tilt of the Earth's axis (obliquity) and changes in the eccentricity of the Earth's orbit are responsible for causing the observed 100 kyr cycle in ice ages by varying the amount of sunlight received by the Earth at different times and locations, particularly high northern latitude summer. These changes in the Earth's orbit are the predictable consequence of interactions between the Earth, its moon, and the other planets. The orbital data shown are from Quinn et al. (1991). Principal frequencies for each of the three kinds of variations are labeled. The solar forcing curve (aka "insolation") is derived from July 1st sunlight at 65 °N latitude according to Jonathan Levine's insolation calculator [1]. The glacial data are from Lisiecki and Raymo (2005) and gray bars indicate interglacial periods, defined here as deviations in the 5 kyr average of at least 0.8 standard deviations above the mean. |
| Datum | 11 februari 2006 (uppladdningsdatum) |
| Källa | Eget arbete |
| Skapare | This image was produced by Robert A. Rohde from publicly available data, and is incorporated into the Global Warming Art project. |
| Andra versioner | Derivative works of this file: Variacions de Milankovitch.png |
References
- Lisiecki, L. E., and M. E. Raymo (2005), "A Pliocene-Pleistocene stack of 57 globally distributed benthic δ18O records." Paleoceanography 20, PA1003, doi:10.1029/2004PA001071 (alternative full text link: [2]).
- Quinn, T. R., S. Tremaine, and M. Duncan (1991), "A Three Million Year Integration of the Earth's Orbit." The Astronomical Journal 101, pp. 2287-2305, doi:10.1086/115850.

|
Denna bild (eller alla bilder i denna artikel eller kategori) bör återskapas med hjälp av vektorgrafik som en SVG-fil. Detta har flera fördelar; se Commons:Media for cleanup för mer information. Om det redan existerar en SVG-version av denna bild, var vänlig och lägg upp den. Efter att en SVG-version lagts upp, ersätt denna mall med {{vector version available|nytt bildnamn.svg}} på denna sida.
|
Licensiering

|
Tillstånd ges att kopiera, distribuera och/eller modifiera detta dokument under villkoren i GNU Free Documentation License, Version 1.2 eller senare version publicerad av Free Software Foundation, utan oföränderliga avsnitt, framsidestexter eller baksidestexter. En kopia av licensen ingår i avsnittet GNU Free Documentation License. |
| Denna fil har gjorts tillgänglig under licensen Creative Commons Erkännande-Dela Lika 3.0 Generisk | ||
| ||
| Detta licenstillägg lades till till denna fil som en del av GFDL:s licensuppdatering. |
Filhistorik
Klicka på ett datum/klockslag för att se filen som den såg ut då.
| Datum/Tid | Miniatyrbild | Dimensioner | Användare | Kommentar | |
|---|---|---|---|---|---|
| nuvarande | 11 februari 2006 kl. 13.35 | | 479 × 363 (32 kbyte) | David Legrand | == Description == This figure shows the variations in Earth's orbit, the resulting changes in solar energy flux at high latitude, and the observed glacial cycles. According to Milankovitch Theory, the precession of the [[ |
Filanvändning
Inga sidor använder den här filen.
Global filanvändning
Följande andra wikier använder denna fil:
- Användande på af.wikipedia.org
- Användande på ar.wikipedia.org
- Användande på be.wikipedia.org
- Användande på bg.wikipedia.org
- Användande på ca.wikipedia.org
- Användande på da.wikipedia.org
- Användande på de.wikipedia.org
- Användande på de.wikiversity.org
- Användande på el.wikipedia.org
- Användande på en.wikipedia.org
- Användande på es.wikipedia.org
- Användande på fa.wikipedia.org
- Användande på fi.wikipedia.org
- Användande på fr.wikipedia.org
- Användande på fy.wikipedia.org
- Användande på gl.wikipedia.org
- Användande på hu.wikipedia.org
- Användande på hy.wikipedia.org
- Användande på id.wikipedia.org
- Användande på ja.wikipedia.org
- Användande på ko.wikipedia.org
- Användande på nl.wikipedia.org
Visa mer globalt användande av denna fil.