
Fil:20210822 Global warming - warming stripes bar chart.svg

Originalfil (SVG-fil, standardstorlek: 1 000 × 750 pixlar, filstorlek: 14 kbyte)
| Denna fil tillhandahålls av Wikimedia Commons. Informationen nedan är kopierad från dess filbeskrivningssida. |
Sammanfattning
| Beskrivning |
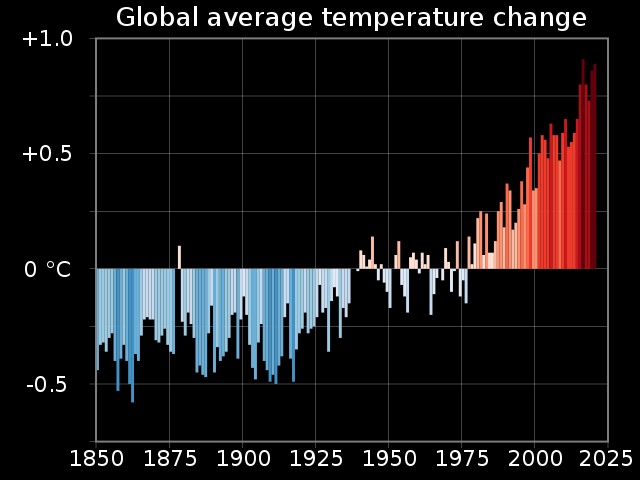
English: Vertical bar chart showing global average temperature change, with each bar/column being coloured according to the Warming stripes colouring scheme of Ed Hawkins (climatologist, who conceived the idea of warming stripes.
 Warming stripes (five examples compared) Warming stripes bar chart Bar chart (vertical) Pie chart Line charts Scatterplot I've uploaded .xlsx (Microsoft Excel) spreadsheets that automatically generate XML code for charts in SVG format. You simply paste or enter your data into the spreadsheet, and specify image dimensions, number of grid lines, font sizes, etc. The spreadsheet instantly and automatically generates a column of XML code that you simply copy and paste into a text editor and save as an ".svg" file. The spreadsheets produce lean SVG code, avoiding the "extra stuff" that Inkscape inserts. They should save you time in creating SVG charts. Feedback and suggestions on my talk page are welcome. RCraig09 (diskussion) 23:41, 19 February 2021 (UTC) Click HOW TO for detailed explanation.
Example SVG files: Category:SVG diagrams created with spreadsheet.
|
| Datum | |
| Källa | Eget arbete |
| Skapare | RCraig09 |
| SVG utveckling | Den här Det chart skapades med Other tools |


Licensiering
- Du är fri:
- att dela – att kopiera, distribuera och sända verket
- att remixa – att skapa bearbetningar
- På följande villkor:
- erkännande – Du måste ge lämpligt erkännande, ange en länk till licensen och indikera om ändringar har gjorts. Du får göra det på ett lämpligt sätt, men inte på ett sätt som antyder att licensgivaren stödjer dig eller din användning.
- dela lika – Om du remixar, transformerar eller bygger vidare på materialet måste du distribuera dina bidrag under samma eller en kompatibel licens som originalet.
Filhistorik
Klicka på ett datum/klockslag för att se filen som den såg ut då.
| Datum/Tid | Miniatyrbild | Dimensioner | Användare | Kommentar | |
|---|---|---|---|---|---|
| nuvarande | 8 augusti 2022 kl. 22.41 | | 1 000 × 750 (14 kbyte) | Sebastian Wallroth | File uploaded using svgtranslate tool (https://svgtranslate.toolforge.org/). Added translation for de. |
| 23 augusti 2021 kl. 22.28 |  | 1 000 × 750 (12 kbyte) | RCraig09 | Version 2: narrowing vertical scale so trace occupies more of image | |
| 23 augusti 2021 kl. 06.03 |  | 1 000 × 750 (13 kbyte) | RCraig09 | Uploaded own work with UploadWizard |
Filanvändning
Inga sidor använder den här filen.
Global filanvändning
Följande andra wikier använder denna fil:
- Användande på en.wikipedia.org
- Talk:SVG
- Wikipedia:SVG help
- Talk:Data and information visualization
- User talk:RCraig09
- Warming stripes
- Talk:Warming stripes
- Wikipedia talk:WikiProject Countries/Archive 13
- Wikipedia talk:WikiProject Climate change/Archive 2
- Talk:Climate change/Archive 86
- User:RCraig09/Excel to XML for SVG
- User talk:RCraig09/Archive 2 (2020)
- Wikipedia:Graphics Lab/Illustration workshop/Archive/Apr 2021
- Passive daytime radiative cooling
- User talk:RCraig09/Archive 3 (2021-2022)
- User talk:RCraig09/Archive 4 (2023)
- Användande på gl.wikipedia.org
- Användande på he.wikipedia.org